Finding pollution—and who it impacts most—in Houston
Houston's sprawling metro area is the energy capital of the United States. Its notorious lack of zoning allows industrial facilities to mix with residential neighborhoods, leaving many vulnerable to dangerous pollution.
Using Google Street View cars, EDF drove 32,000 miles, measuring air pollution and mapping its reach across neighborhoods throughout Houston.
Our maps of 22 neighborhoods paint a vivid picture of pollution, race, poverty and health in Texas' largest metro area.
- Explore further
- What we should do
- How we did it
- Our partners
Some neighborhood roads are as polluted as areas near major freeways
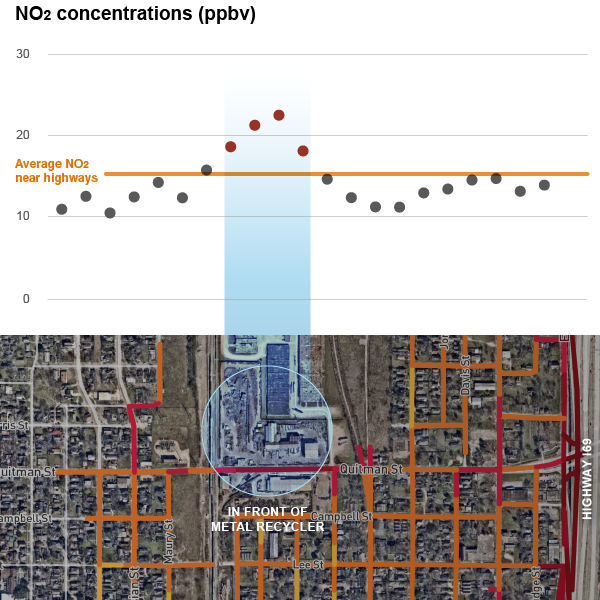
The pollution outside of 1/3 of the concrete batch plants and metal recyclers we surveyed was similar to that in the areas along major freeways.
Ramon Alvarez, Associate Chief Scientist
Metal recycling and concrete batch plants--which produce cancer-causing particulate air toxics--are also magnets for heavy duty vehicles. Diesel-fueled vehicles within the heavy-duty fleet emit black carbon and NOx into many of Houston's residential neighborhoods.
Our researchers found pollution levels similar to the areas near highways at one third of these facilities within the neighborhoods we sampled.
These results demonstrate how the city's lack of zoning places some of Houston's most vulnerable people in the path of harmful pollution. In fact, nearly a third (29%) of the area's concrete batch plants and more than half (51%) of the area's metal recycling facilities are located within a half mile of at least one school or childcare center.
Nearly half of Houston's schools face elevated pollution
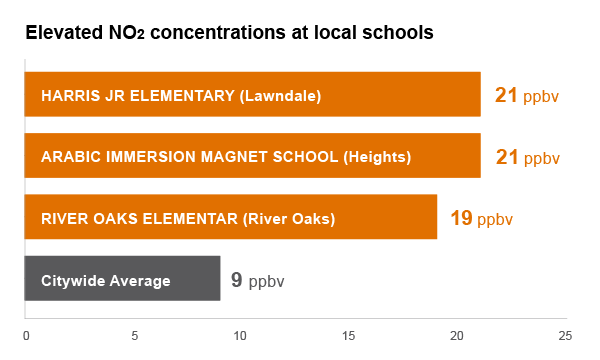
By mapping our air quality data alongside the locations of schools, local pollution sources, and sociodemographic information, we can better understand not only where pollution is at its worst but who that pollution impacts.
We found that even children whose schools aren't near major industrial facilities could face elevated pollution levels. Our researchers measured nitrogen dioxide (NO2) levels above the typical citywide levels outside nearly half (46%) of the schools and childcare centers we monitored.
This can have a profound impact on children's health. Exposure to nitrogen oxides (NO and NO2) can result in the development and exacerbations of asthma and bronchitis.
Your zip code can determine your health
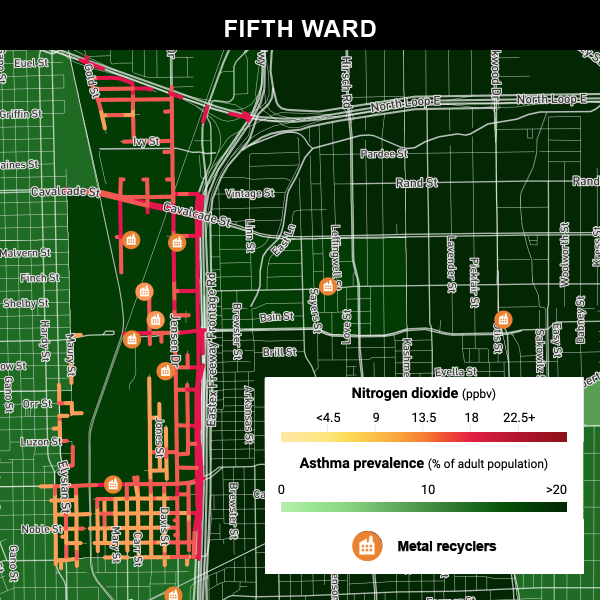
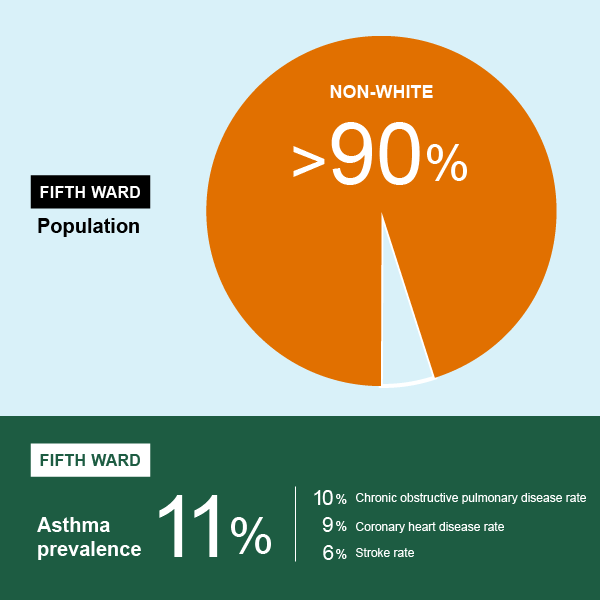
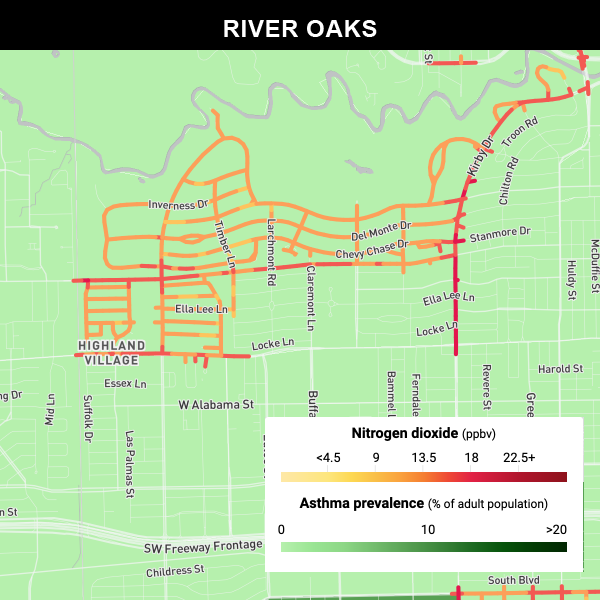
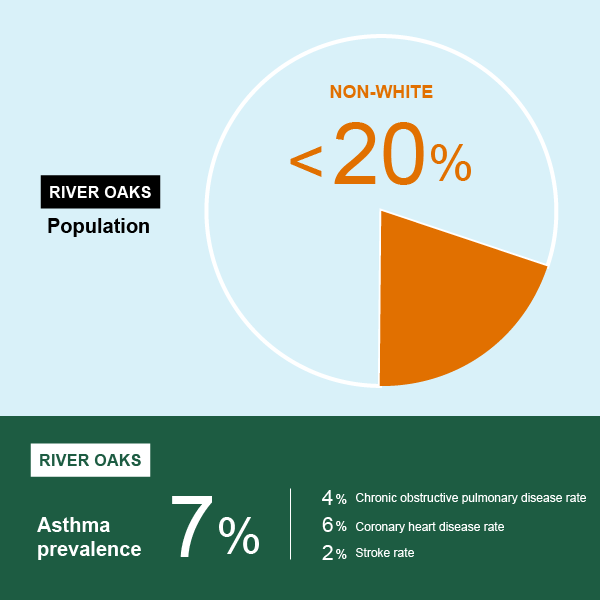
Many of the area communities that are home to people of color, individuals facing chronic illnesses and residents who struggle financially are also plagued by high pollution levels.
Houston's Fifth Ward is home to a cluster of metal recyclers and concrete processing plants. Our study found NO2 levels here were 48% higher than the rest of the city. Residents are largely people of color (more than 90% non-white); 40% live below the federal poverty line. They face higher rates of asthma (11%, compared to 9%), Chronic Obstructive Pulmonary Disease (COPD) (10%, compared to 6%), Coronary Heart Disease (9% compared to 5%) and stroke (6% compared to 3%). Life expectancy is almost a decade lower than the rest of the region (69 compared to 78 years).
River Oaks, by contrast, doesn't have any of these industrial sources and features lower levels of pollution. Its largely white population is one of the wealthiest in the area. Residents here have less asthma (7%), COPD (4%), and fewer strokes (2%) than the area average, and those who live there live longer (85 years) than their regional counterparts.
Using data to improve lives
By understanding where pollution is at its worst, who it impacts and what it means for their health, city planners, communities and public health officials can make smart decisions to improve the lives of some of their most vulnerable.
Much of this pollution is preventable. If cities and communities use this data to identify major polluters, they can prioritize targeted inspection and enforcement, deploying their resources when and where they're needed most.
- Explore further
- What we should do
- How we did it
- Our partners


![[alt text]](/sites/default/files/content/Houston-thumbnail.jpg)

